Skip to content

Climate & travel seasons

Climate and the best time to visit your destination

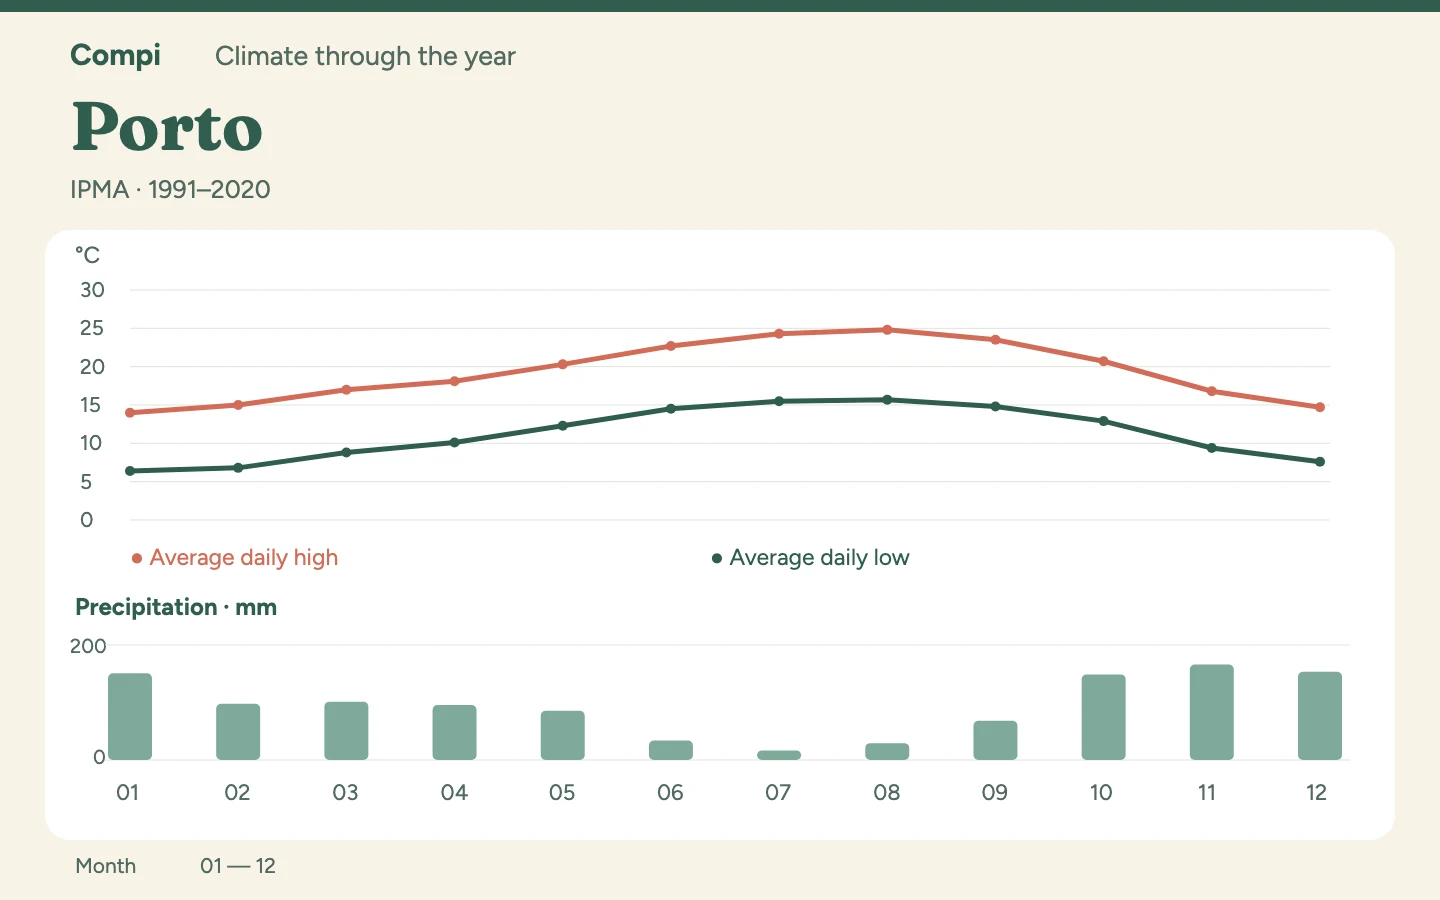
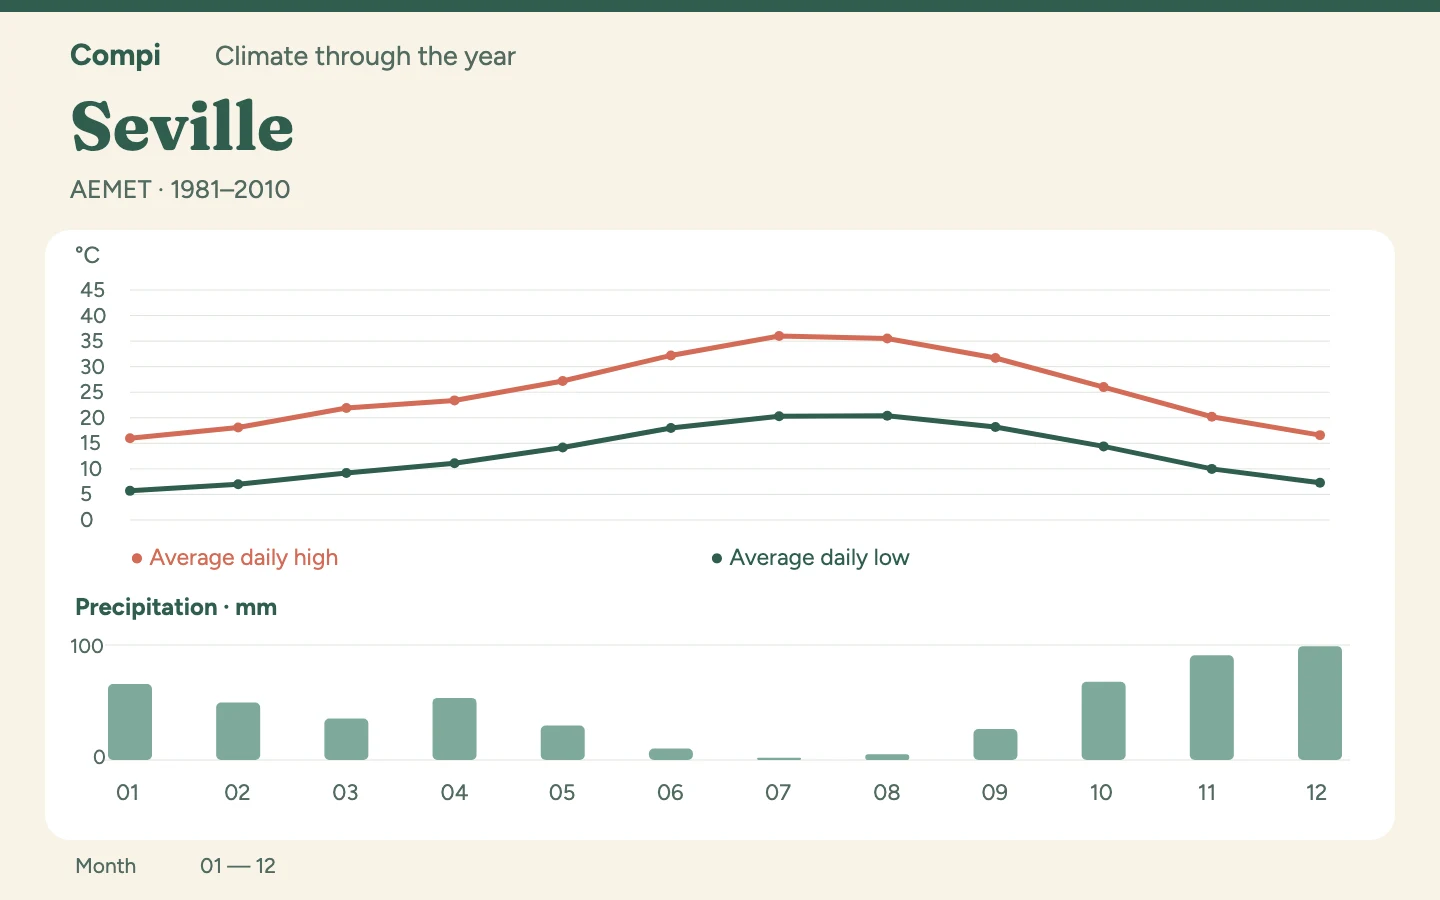
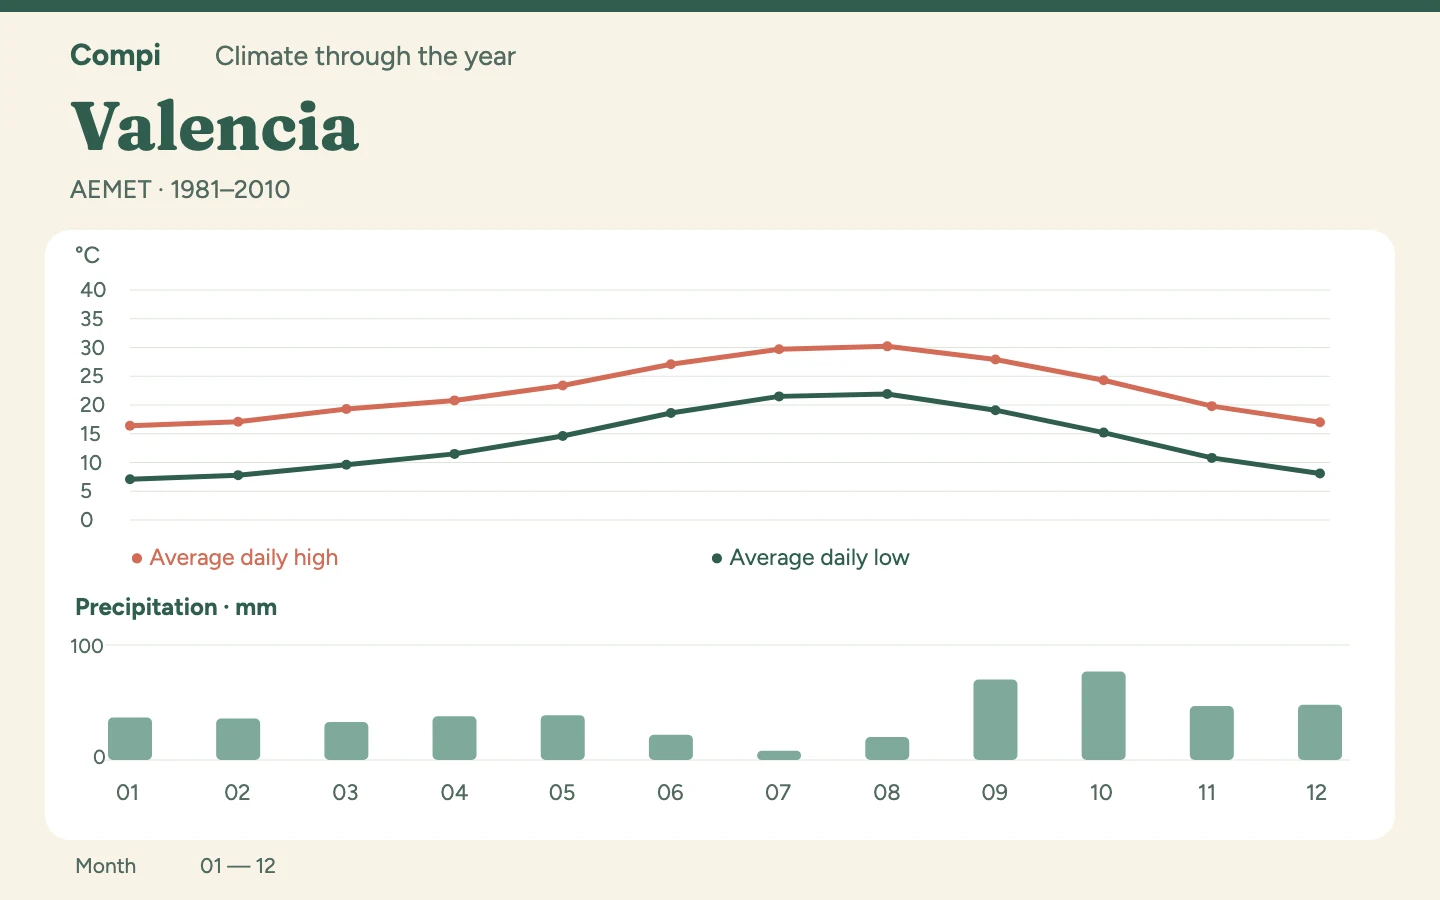
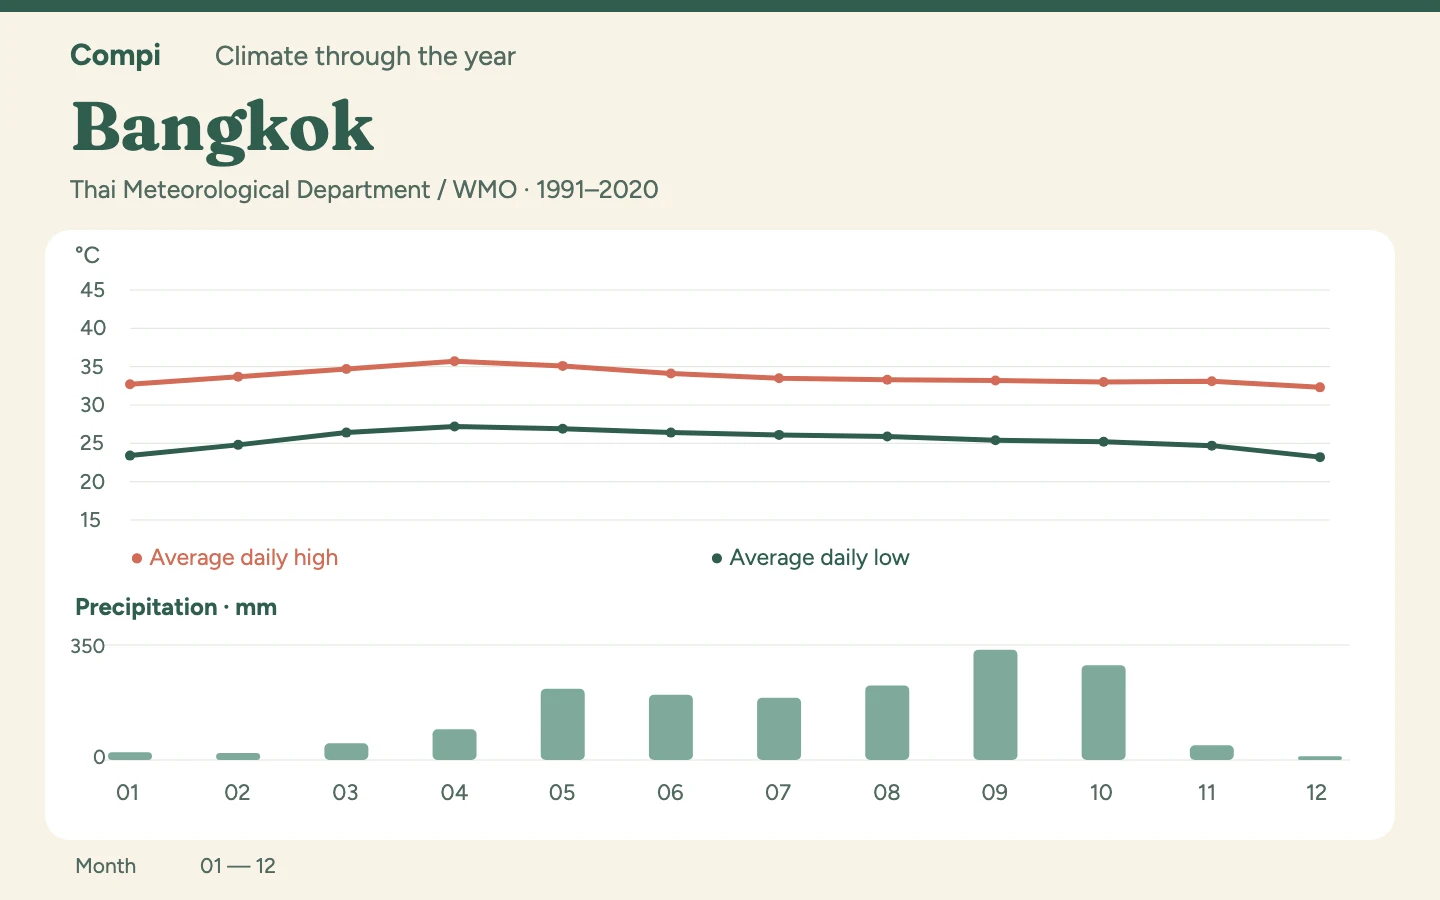
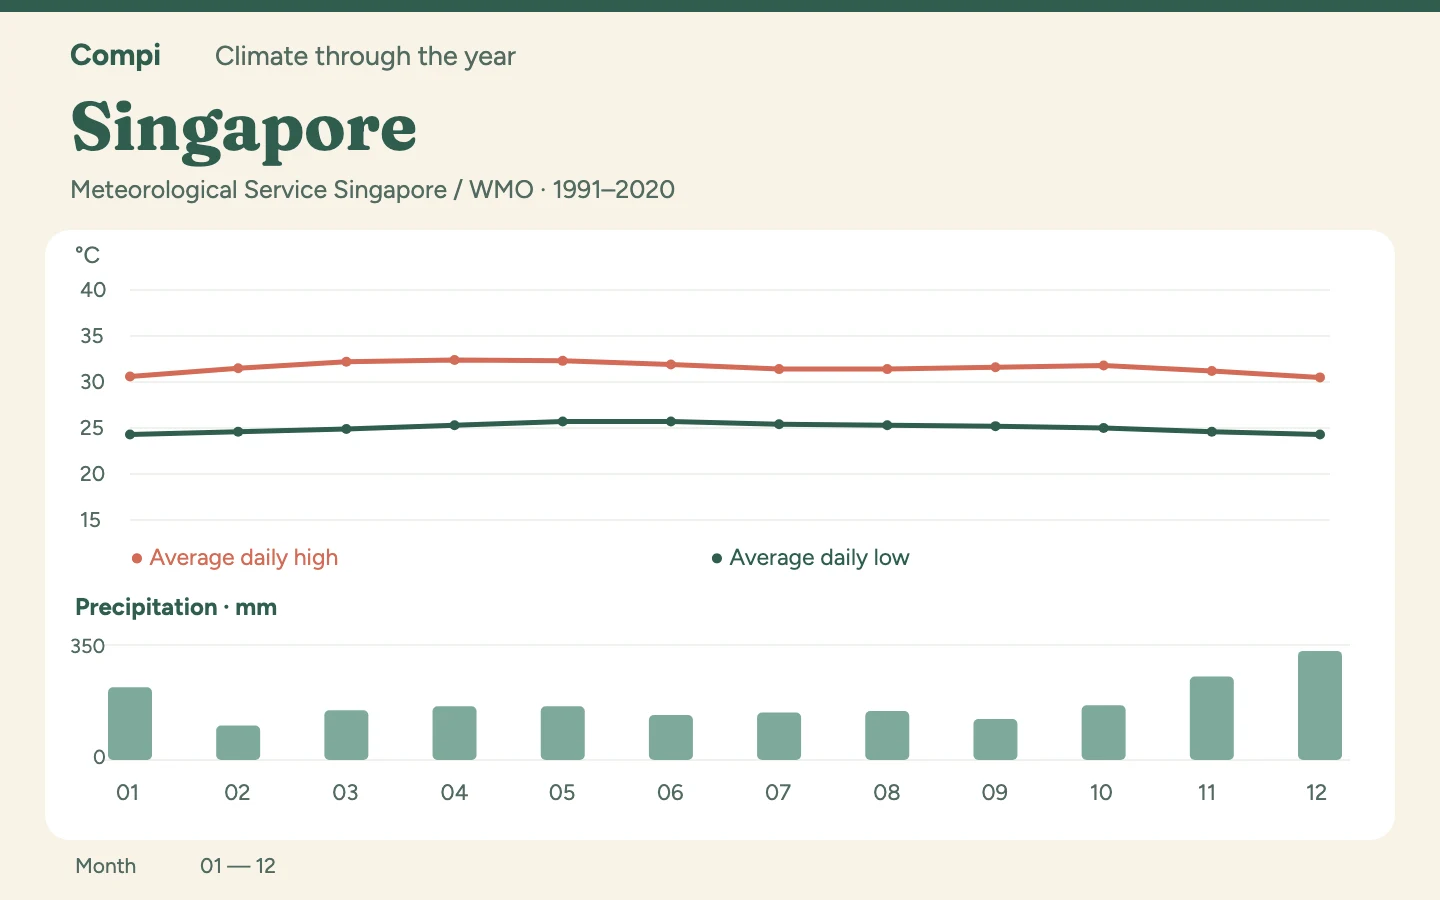
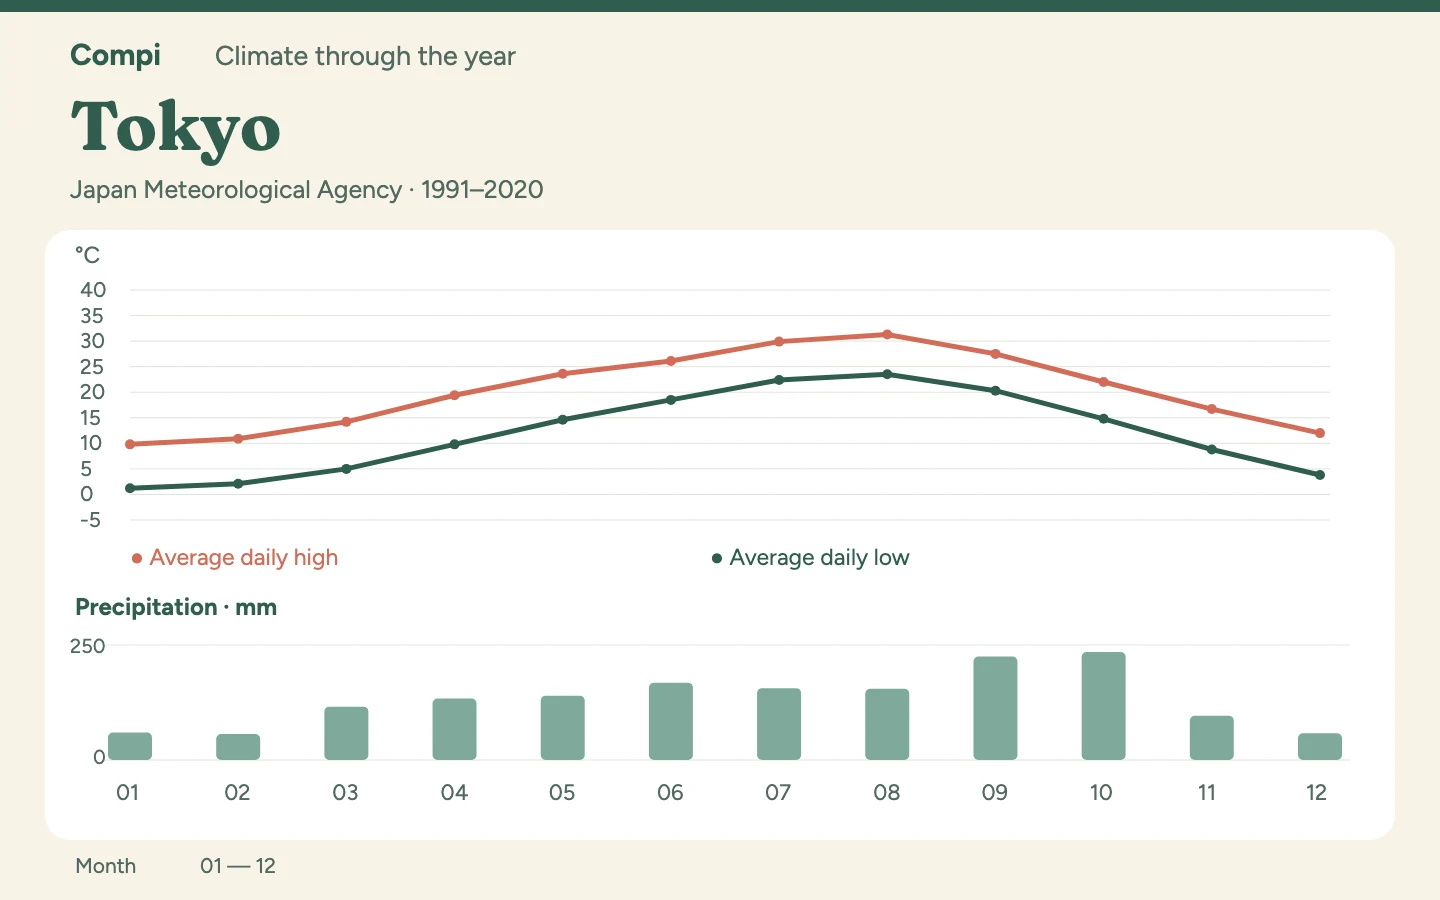
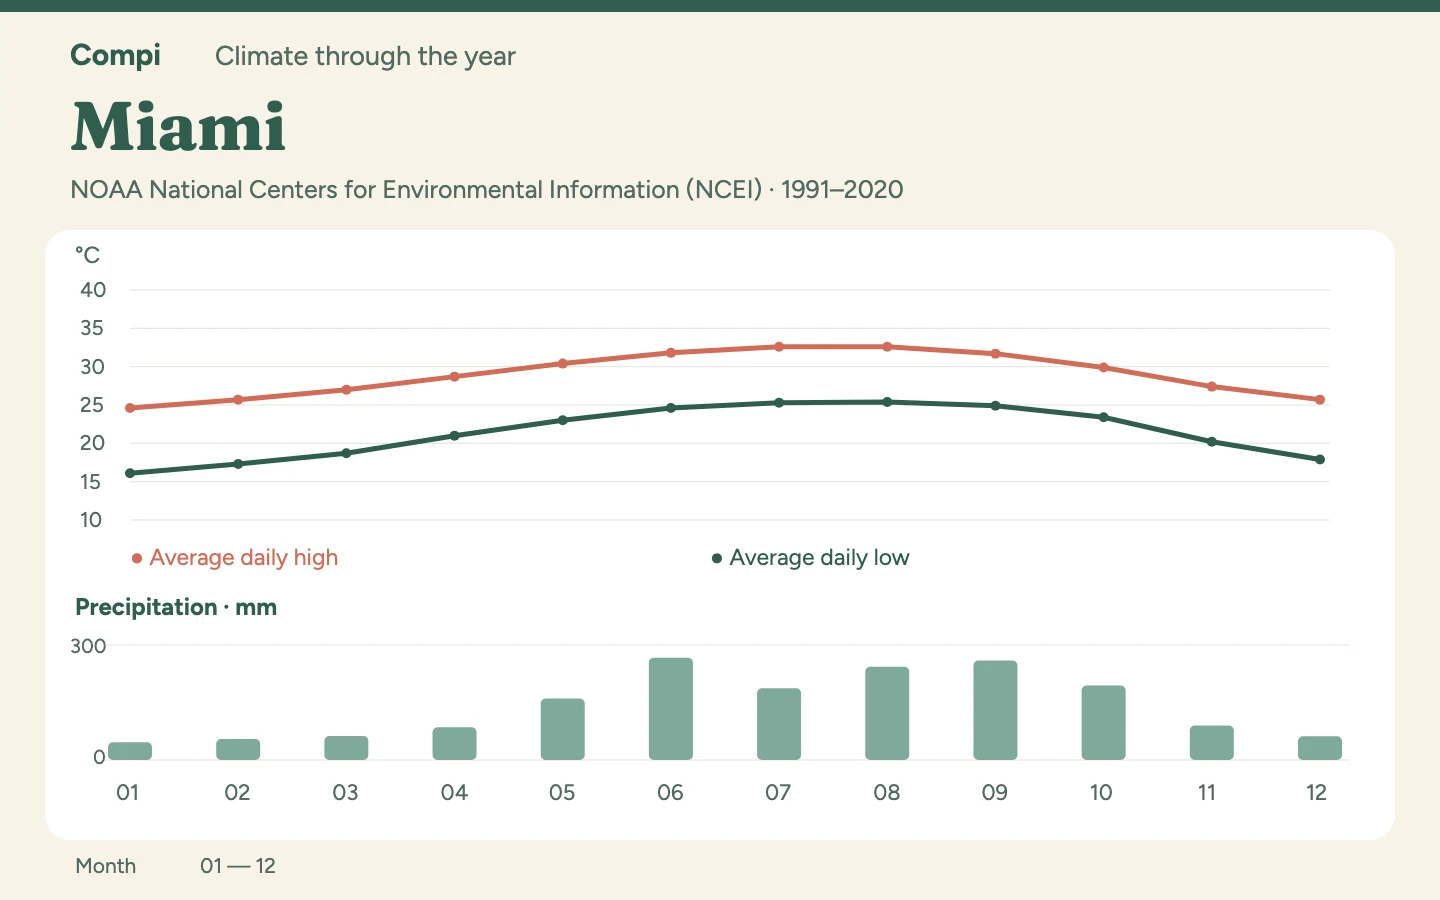
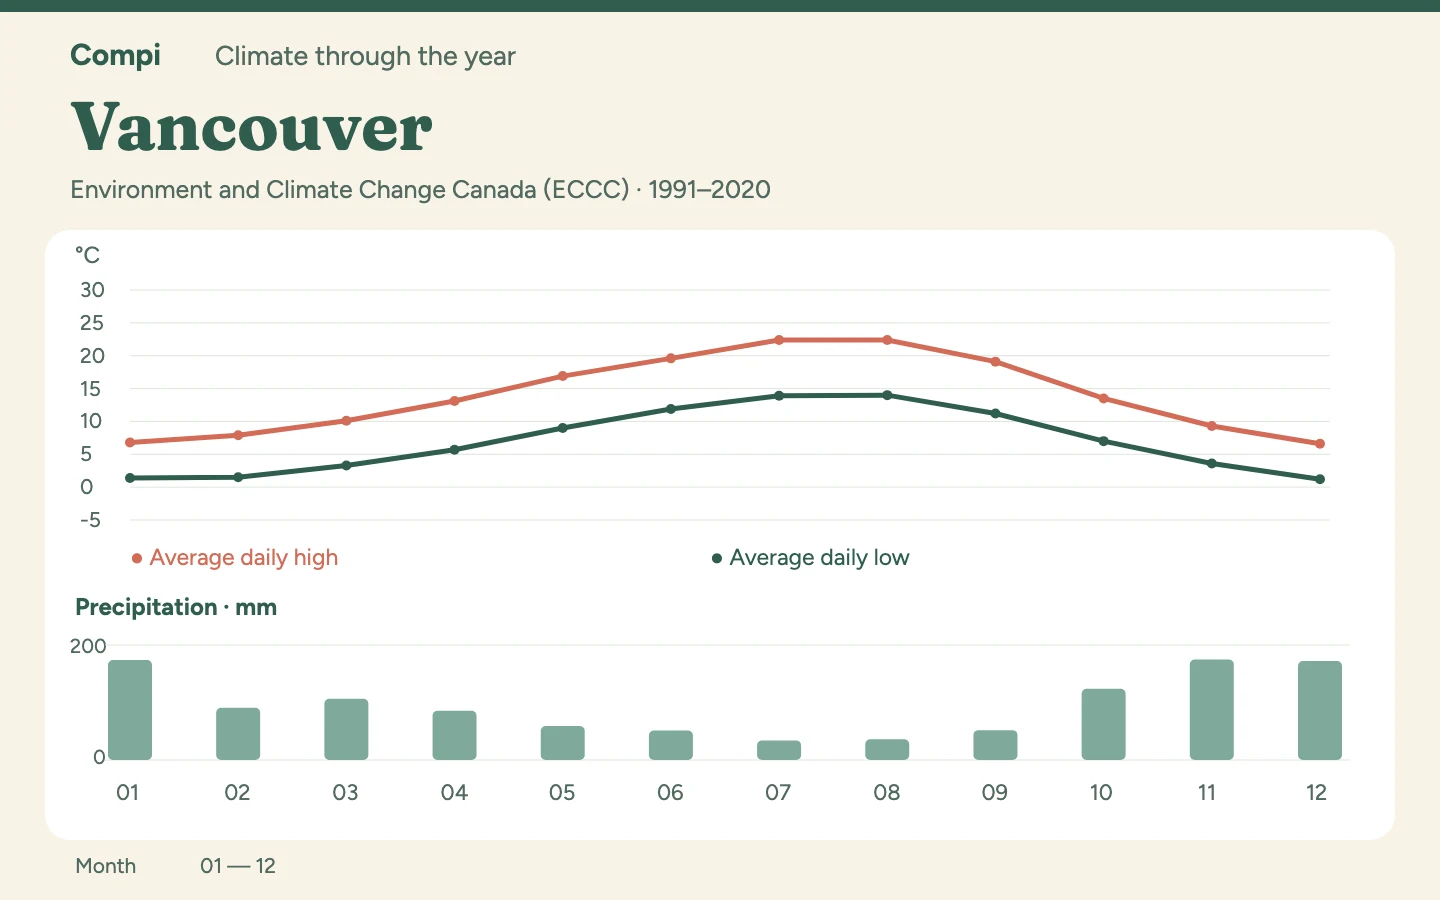
When does your destination suit your plans? Explore climate tables and practical month-to-month comparisons, then choose a destination to see how warmth and rainfall change through the year.

How to read our climate tables ↓

Destinations through the year

Europe

Asia

North America & the Pacific

Africa

How to read our climate tables

Climate helps you choose a travel season. A weather forecast helps you plan individual days nearer departure. They answer different questions.

  • Tables use published monthly normals from official weather services or their station records in the WMO/NOAA archive. Each article identifies the source, station and reference period.
  • Most series cover 1991–2020; the AEMET series used here cover 1981–2010. A station describes its location, not every nearby coast or elevation. We do not turn these different series into a universal destination ranking.
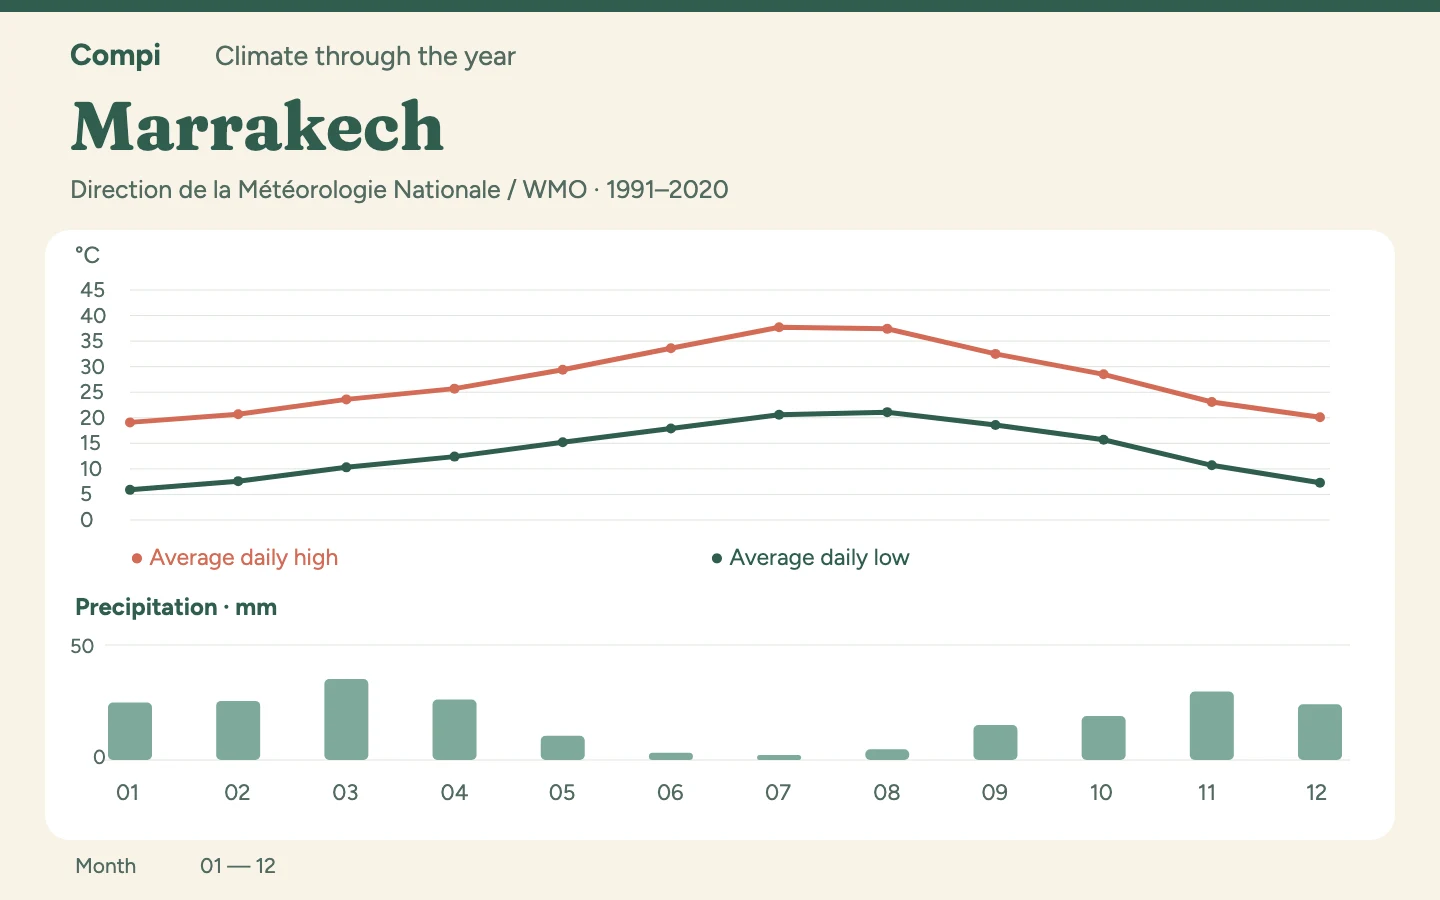
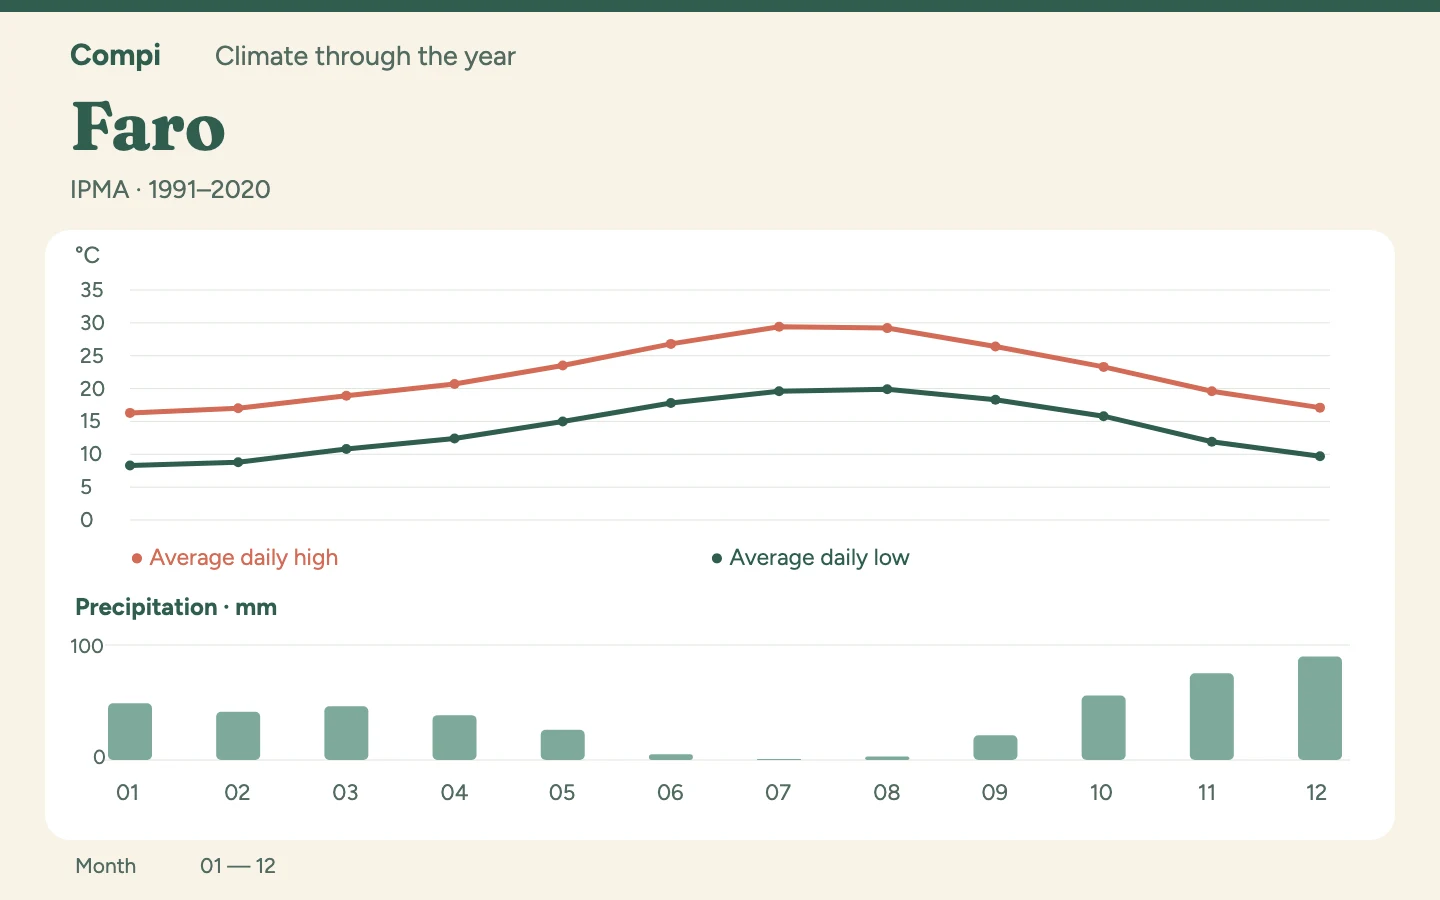
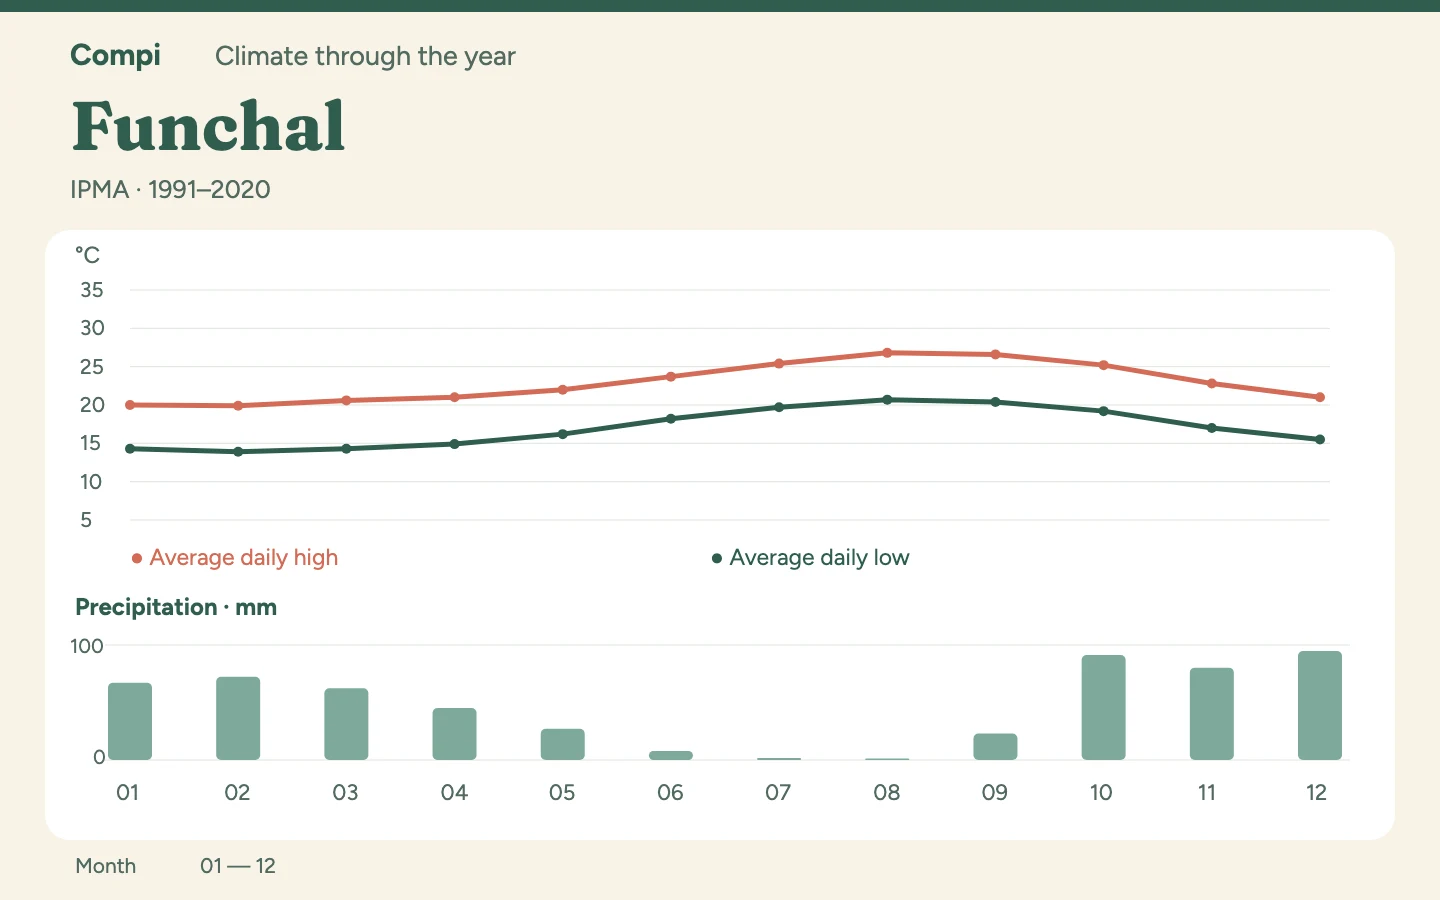
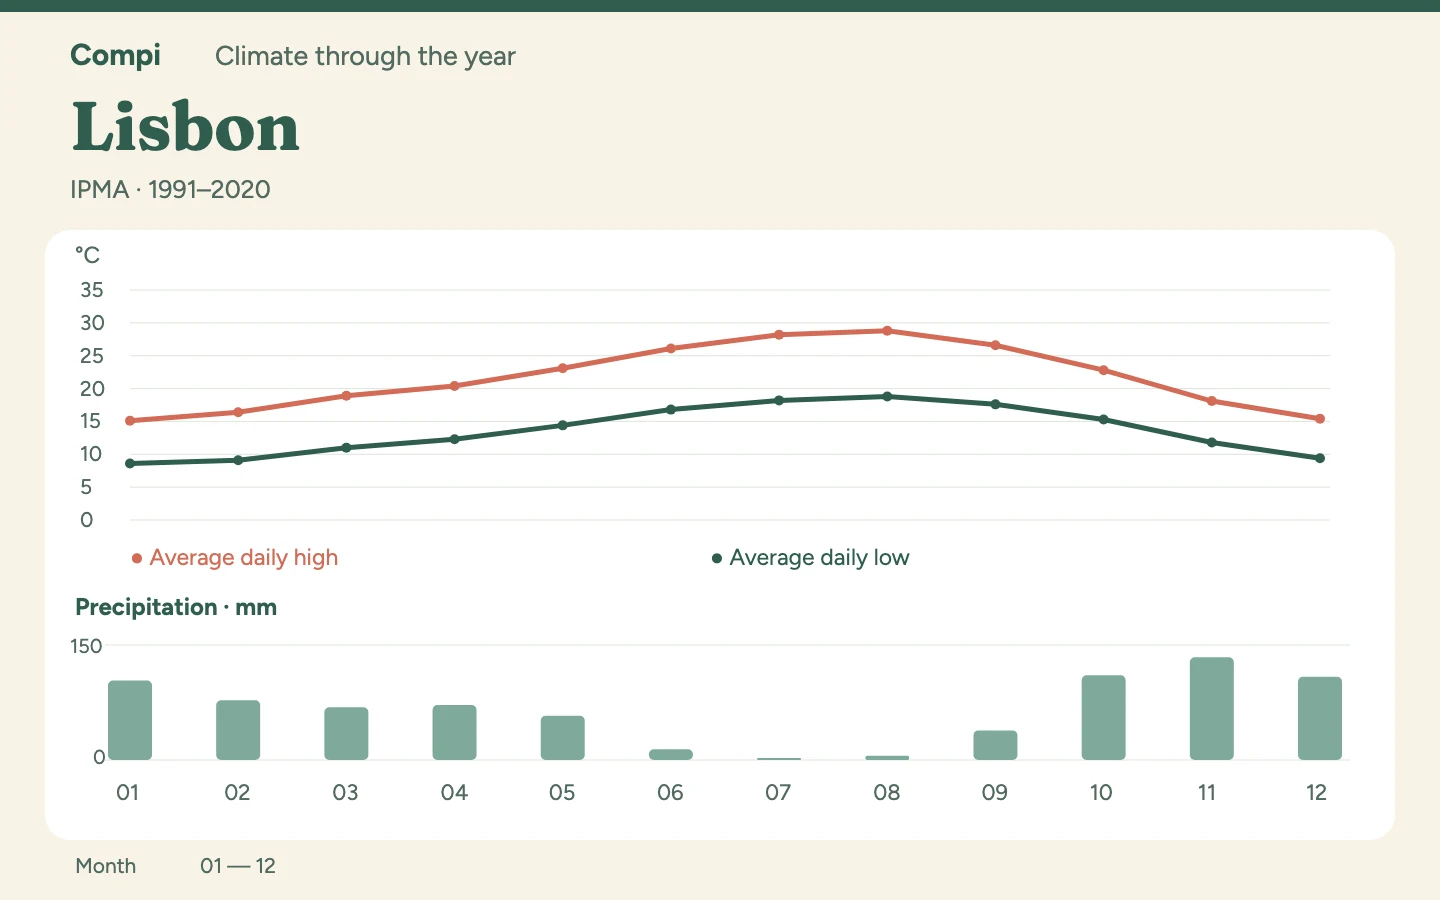
  • Daily highs and lows are monthly averages of daily maxima and minima, not records. Rainfall in millimetres is a monthly total. Rain days use the stated threshold, such as ≥1 mm or ≥0.1 mm in Taipei. Missing measurements do not mean zero.
  • A monthly average does not predict the weather on your travel date. Check a local forecast shortly before departure. Travel-season recommendations are editorial interpretations of the cited data; these climate tables do not provide current conditions or weather alerts.

Original sources are linked in each climate article.

From travel season to travel plan

Keep suitable dates and ideas in Compi. Plan directly or connect an AI assistant. The climate table is not automatically transferred into a trip.

How to connect Compi to ChatGPT or Claude →
Discover trip templates (in German) →