Travel guides
Seville climate: monthly weather and when to visit
Seville month by month: official climate normals for daily highs and lows, rainfall and wet days, with practical comparisons to help you choose when to visit.
By Compi3 min read
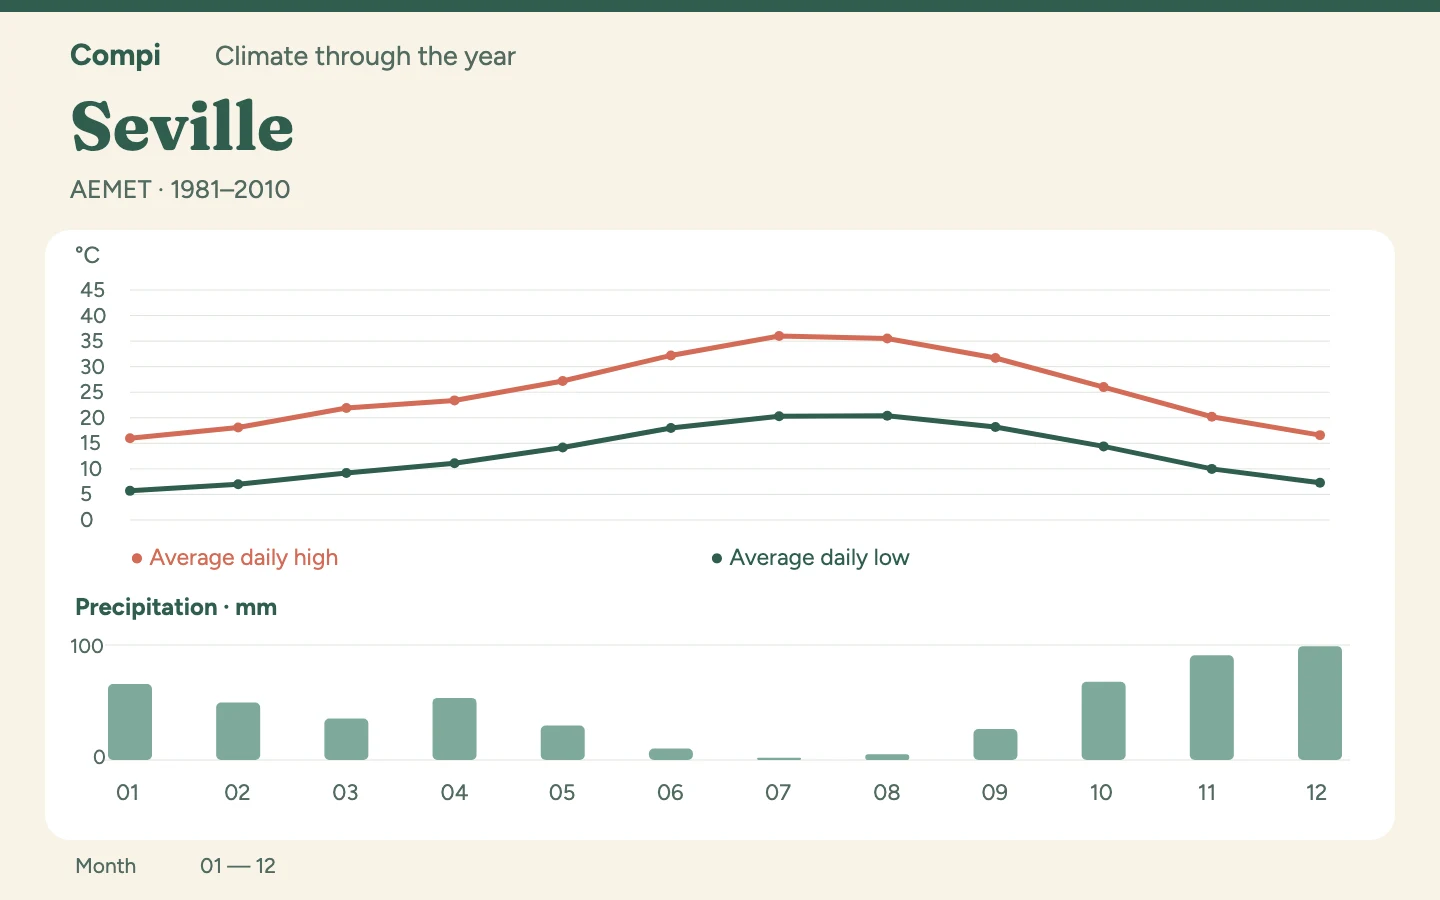
For long sightseeing walks in Seville, I would put March, April or October ahead of midsummer. July and August are very dry, but average daytime highs sit around 36 °C. May is another option if you enjoy warmth; September remains substantially hotter on average.
Which months suit your plans?#
April and October show why a broad recommendation for spring and autumn needs unpacking. October has higher average highs and lows, as well as more rain, even though the number of wet days is identical. May and September differ even more in daytime warmth. September is not a cool substitute for summer in this station record.
All twelve months#
Source: AEMET, Sevilla Aeropuerto station (5783), elevation 34.0 m; climate normals 1981–2010.
| Month | Avg daily high °C | Avg daily low °C | Precipitation mm | Days with ≥ 1 mm |
|---|---|---|---|---|
| January | 16.0 | 5.7 | 66 | 6.1 |
| February | 18.1 | 7.0 | 50 | 5.8 |
| March | 21.9 | 9.2 | 36 | 4.3 |
| April | 23.4 | 11.1 | 54 | 6.1 |
| May | 27.2 | 14.2 | 30 | 3.7 |
| June | 32.2 | 18.0 | 10 | 1.3 |
| July | 36.0 | 20.3 | 2 | 0.2 |
| August | 35.5 | 20.4 | 5 | 0.5 |
| September | 31.7 | 18.2 | 27 | 2.4 |
| October | 26.0 | 14.4 | 68 | 6.1 |
| November | 20.2 | 10.0 | 91 | 6.4 |
| December | 16.6 | 7.3 | 99 | 7.5 |
Compare two months directly#
April and October: Average daily highs are 23.4 and 26.0 °C respectively, with lows of 11.1 and 14.4 °C. Rainfall totals are 54 versus 68 mm, alongside an average of 6.1 days in both months with at least 1 mm.
May and September: Average daily highs are 27.2 and 31.7 °C respectively, with lows of 14.2 and 18.2 °C. Rainfall totals are 30 versus 27 mm, alongside an average of 3.7 versus 2.4 days with at least 1 mm.
What the local station covers#
The reference is Seville airport, at 34 metres above sea level. These are not measurements for every shaded lane or open square. For a full sightseeing itinerary, I would first choose a month according to my tolerance for heat, then arrange the individual walks. The driest period does not automatically win that decision.
Above 30 °C from June to September#
Average daily highs exceed 30 °C from June through September. If you want to avoid that level of warmth on extended walks, consider the whole stretch rather than July and August alone. November is cooler than October, at 20.2 °C, but receives 91 rather than 68 mm of rain. In January, the average low is 5.7 °C: a daytime high of 16.0 °C is not enough information for a winter packing list. March combines a high of 21.9 °C with 36 mm of precipitation, making March another option, alongside April, for a trip with plenty of walking.
Rainfall totals cover the whole month; wet days count only days with at least 1 mm. They do not describe shower duration or intensity. Highs and lows are means of daily maximum and minimum temperatures.
These historical normals describe 1981–2010, not the current travel year; series with different reference periods are not directly comparable.