Travel guides
Valencia climate: monthly weather and when to visit
Valencia month by month: official climate normals for daily highs and lows, rainfall and wet days, with practical comparisons to help you choose when to visit.
By Compi4 min read
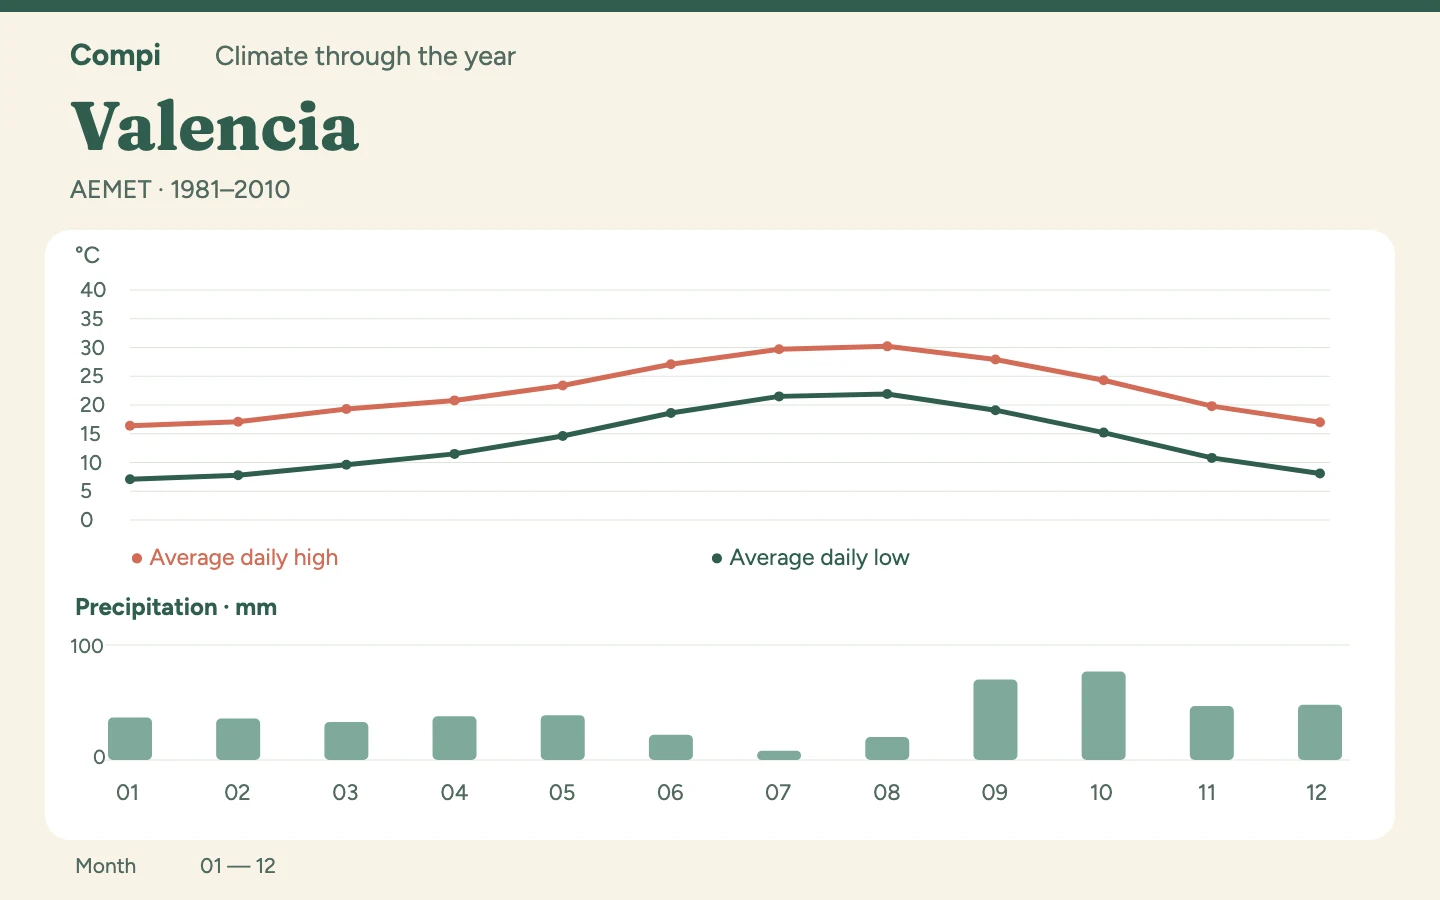
For a Valencia city break, I would choose May if moderate warmth matters more than finding the driest month. June is warmer and drier. September stays warm but receives much more rain than June. The figures describe AEMET València station 8416 at 13 metres, rather than the entire region.
Which months suit your plans?#
May and October have similar average highs, yet October receives almost twice as much precipitation. The number of wet days increases only slightly. That is why rainfall amount and wet-day frequency answer different questions: more water does not necessarily mean many more affected calendar days. June and September are another similarly warm pair, with an even larger difference in rainfall.
All twelve months#
Source: AEMET, València station (8416), elevation 13.0 m; climate normals 1981–2010.
| Month | Avg daily high °C | Avg daily low °C | Precipitation mm | Days with ≥ 1 mm |
|---|---|---|---|---|
| January | 16.4 | 7.1 | 37 | 4.4 |
| February | 17.1 | 7.8 | 36 | 3.9 |
| March | 19.3 | 9.6 | 33 | 3.6 |
| April | 20.8 | 11.5 | 38 | 4.8 |
| May | 23.4 | 14.6 | 39 | 4.3 |
| June | 27.1 | 18.6 | 22 | 2.6 |
| July | 29.7 | 21.5 | 8 | 1.1 |
| August | 30.2 | 21.9 | 20 | 2.4 |
| September | 27.9 | 19.1 | 70 | 5.0 |
| October | 24.3 | 15.2 | 77 | 5.0 |
| November | 19.8 | 10.8 | 47 | 4.3 |
| December | 17.0 | 8.1 | 48 | 4.8 |
Compare two months directly#
May and October: Average daily highs are 23.4 and 24.3 °C respectively, with lows of 14.6 and 15.2 °C. Rainfall totals are 39 versus 77 mm, alongside an average of 4.3 versus 5.0 days with at least 1 mm.
June and September: Average daily highs are 27.1 and 27.9 °C respectively, with lows of 18.6 and 19.1 °C. Rainfall totals are 22 versus 70 mm, alongside an average of 2.6 versus 5.0 days with at least 1 mm.
Summer warmth and long city walks#
For long city walks, I would favour May or June if you prefer less heat. Average highs rise from 27.1 °C in June to 29.7 °C in July and 30.2 °C in August; lows rise from 18.6 to 21.5 and 21.9 °C. June and August have almost the same rainfall, at 22 and 20 mm. Lower temperatures therefore favour June, rather than any substantial rainfall difference. July is drier at 8 mm but also warmer. Water temperature and waves are separate information you would need for beach days.
Autumn rain or cooler winter days?#
October has the year's largest rainfall total, at 77 mm, followed by September at 70 mm. Both have 5.0 wet days, close to April's 4.8, even though April receives just 38 mm. Rainfall amount therefore deserves particular attention for an autumn visit, without implying anything about the duration of individual showers. January and February are drier at 37 and 36 mm, but their average highs of 16.4 and 17.1 °C are much lower. They offer an alternative for cooler city walks; if warm evenings matter, also consider average lows of 7.1 and 7.8 °C.
Rainfall totals cover the whole month; wet days count only days with at least 1 mm. They do not describe shower duration or intensity. Highs and lows are means of daily maximum and minimum temperatures.
These historical normals describe 1981–2010, not the current travel year; series with different reference periods are not directly comparable.