Travel guides
Lisbon climate: monthly weather and when to visit
Lisbon month by month: official climate normals for daily highs and lows, rainfall and wet days, with practical comparisons to help you choose when to visit.
By Compi3 min read
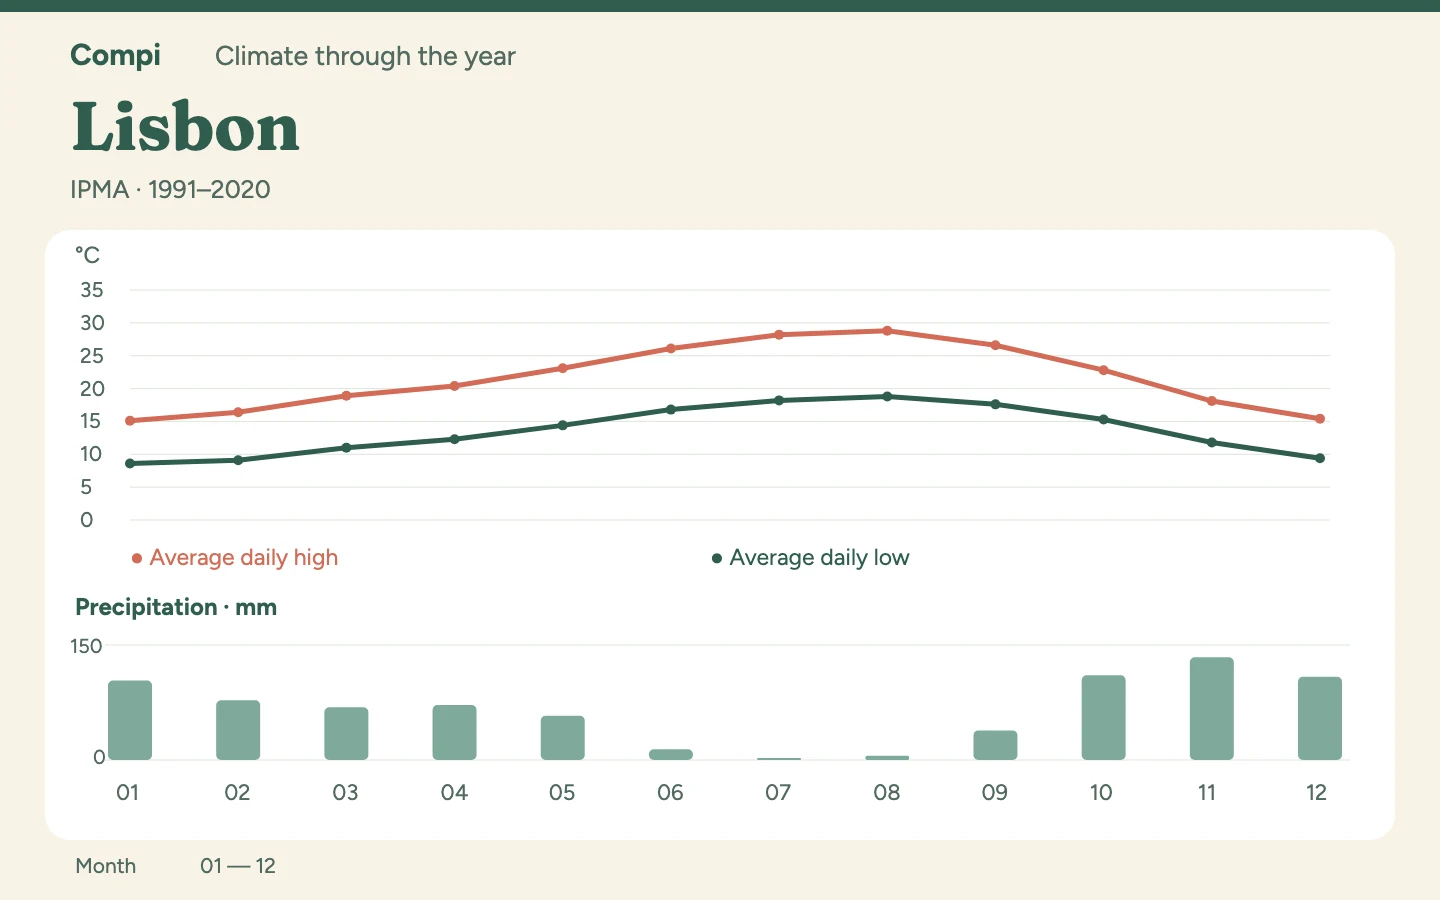
For a walking-heavy Lisbon break, I would choose May or June: May is cooler, while June is much drier. September is another warm option. July and August have the smallest rainfall totals but higher average daily maxima. These figures come from the city's Instituto Geofísico station, rather than representing the whole Portuguese coast.
Which months suit your plans?#
May and October look surprisingly similar for temperature, but October receives almost twice as much precipitation. That gives May a clear advantage if your plans involve spending most of each day outdoors. June combines fewer wet days with warmer weather; I would allow more breaks on long city walks then. September stays warm, although its rainfall total is higher than June's.
All twelve months#
Source: IPMA, Lisboa, Geofisico station (535), elevation 77.0 m; climate normals 1991–2020. The IPMA series combines observations with locally modelled data.
| Month | Avg daily high °C | Avg daily low °C | Precipitation mm | Days with ≥ 1 mm |
|---|---|---|---|---|
| January | 15.1 | 8.6 | 103.8 | 10.0 |
| February | 16.4 | 9.1 | 77.8 | 7.9 |
| March | 18.9 | 11.0 | 68.7 | 7.6 |
| April | 20.4 | 12.3 | 71.8 | 7.9 |
| May | 23.1 | 14.4 | 57.8 | 5.8 |
| June | 26.1 | 16.8 | 14.1 | 2.0 |
| July | 28.2 | 18.2 | 2.6 | 0.6 |
| August | 28.8 | 18.8 | 5.4 | 1.1 |
| September | 26.6 | 17.6 | 38.6 | 3.8 |
| October | 22.8 | 15.3 | 110.6 | 8.7 |
| November | 18.1 | 11.8 | 133.9 | 9.9 |
| December | 15.4 | 9.4 | 108.5 | 10.0 |
Compare two months directly#
May and October: Average daily highs are 23.1 and 22.8 °C respectively, with lows of 14.4 and 15.3 °C. Rainfall totals are 57.8 versus 110.6 mm, alongside an average of 5.8 versus 8.7 days with at least 1 mm.
June and September: Average daily highs are 26.1 and 26.6 °C respectively, with lows of 16.8 and 17.6 °C. Rainfall totals are 14.1 versus 38.6 mm, alongside an average of 2.0 versus 3.8 days with at least 1 mm.
What the local station covers#
The station stands at 77 metres in Lisbon. A stay on the coast or in the hills outside the city needs its own local forecast. One city climate table cannot resolve those differences, so keep this reference attached to the Lisbon part of your trip.
Why November needs a different plan#
November has Lisbon's largest average rainfall total, at 133.9 mm. January and December each have 10.0 wet days, compared with November's 9.9: similar frequency can accompany different amounts of water. For a winter-season break, I would therefore choose by temperature rather than search for a supposedly dry month. November has an average high of 18.1 °C, January 15.1 °C. July offers just 2.6 mm and 0.6 wet days, but a high of 28.2 °C. That dry-summer advantage comes with more warmth on long walks. June, at 26.1 °C and 14.1 mm, offers a concrete compromise between the two.
Rainfall totals cover the whole month; wet days count only days with at least 1 mm. They do not describe shower duration or intensity. Highs and lows are means of daily maximum and minimum temperatures.