Travel guides
Porto climate: monthly weather and when to visit
Porto month by month: official climate normals for daily highs and lows, rainfall and wet days, with practical comparisons to help you choose when to visit.
By Compi3 min read
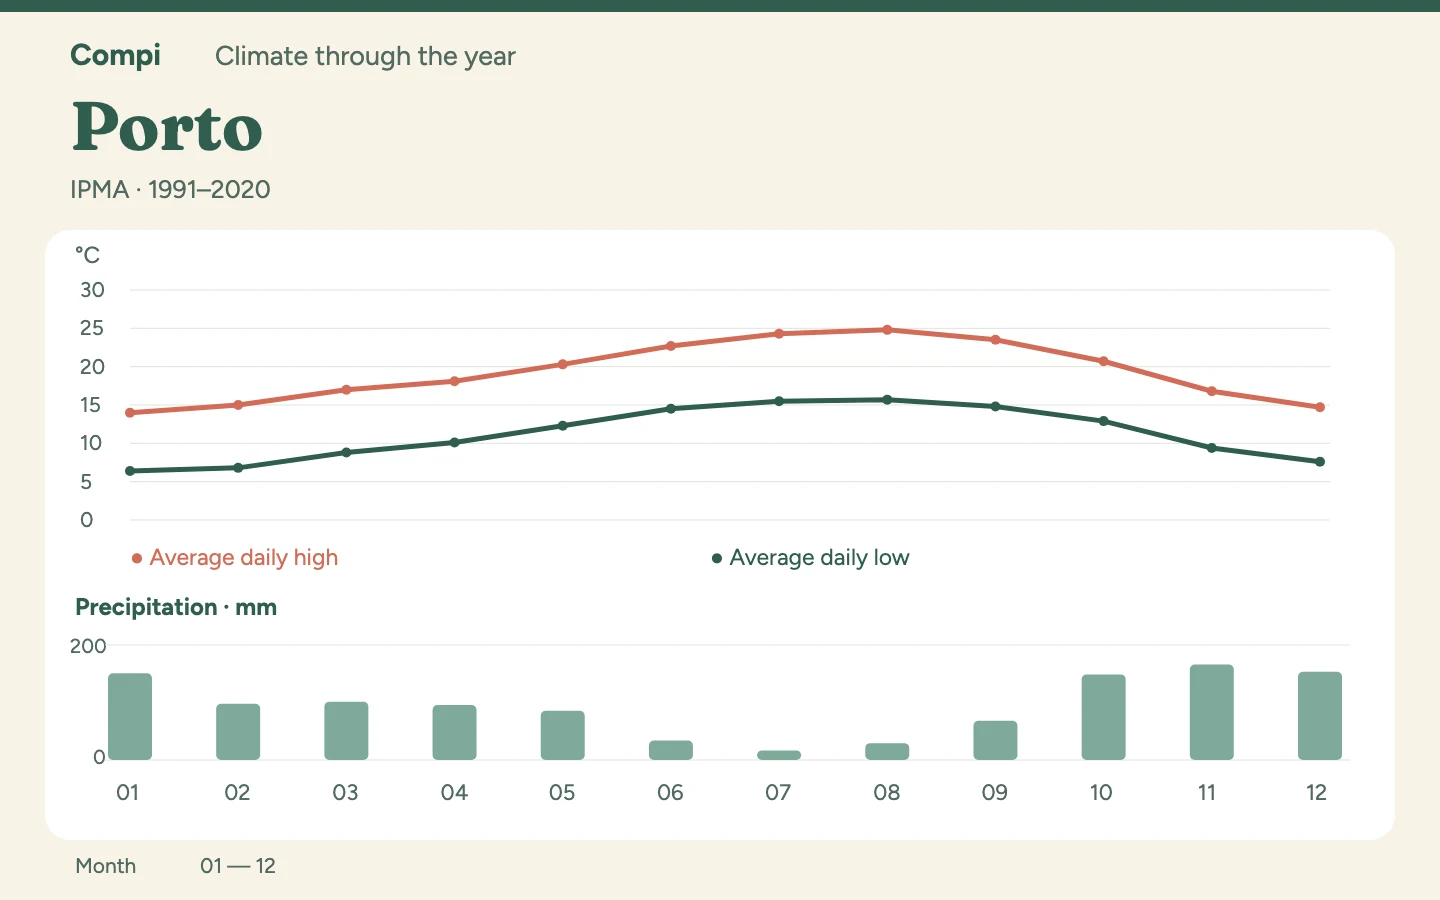
For Porto, I would look at June to August to combine relatively little rain with moderate summer warmth. September is warmer than spring and, at 68.2 mm, drier than April and May, though wetter than summer. October marks a substantial change from September: its precipitation total is more than twice as high.
Which months suit your plans?#
The autumn months often appear together in travel advice, but deserve separate attention here. Wet days also almost double from September to October while average highs fall. September therefore offers a stronger starting point for plans involving many hours outside. The midsummer comparison is different: July and August have almost the same number of wet days, yet August receives noticeably more precipitation.
All twelve months#
Source: IPMA, Porto / Pedras Rubras station (545), elevation 67.7 m; climate normals 1991–2020. The IPMA series combines observations with locally modelled data.
| Month | Avg daily high °C | Avg daily low °C | Precipitation mm | Days with ≥ 1 mm |
|---|---|---|---|---|
| January | 14.0 | 6.4 | 151.0 | 12.8 |
| February | 15.0 | 6.8 | 97.8 | 10.0 |
| March | 17.0 | 8.8 | 101.1 | 9.9 |
| April | 18.1 | 10.1 | 95.5 | 10.4 |
| May | 20.3 | 12.3 | 85.6 | 8.9 |
| June | 22.7 | 14.5 | 33.7 | 4.9 |
| July | 24.3 | 15.5 | 16.6 | 3.1 |
| August | 24.8 | 15.7 | 29.3 | 3.2 |
| September | 23.5 | 14.8 | 68.2 | 5.8 |
| October | 20.7 | 12.9 | 148.9 | 11.1 |
| November | 16.8 | 9.4 | 165.9 | 13.0 |
| December | 14.7 | 7.6 | 153.3 | 12.4 |
Compare two months directly#
September and October: Average daily highs are 23.5 and 20.7 °C respectively, with lows of 14.8 and 12.9 °C. Rainfall totals are 68.2 versus 148.9 mm, alongside an average of 5.8 versus 11.1 days with at least 1 mm.
July and August: Average daily highs are 24.3 and 24.8 °C respectively, with lows of 15.5 and 15.7 °C. Rainfall totals are 16.6 versus 29.3 mm, alongside an average of 3.1 versus 3.2 days with at least 1 mm.
What the local station covers#
Porto/Pedras Rubras station is at an elevation of 67.7 metres. It is a local reference for the Porto area, not for the entire Douro valley. If your trip continues inland, do not carry these temperatures along as though they describe the whole route.
From wet winter to drier June#
November leads Porto for both rainfall amount, at 165.9 mm, and wet days, at 13.0. January is similarly wet at 151.0 mm and 12.8 days, with a lower average high of 14.0 °C. For a winter visit, I would combine short outdoor routes with longer indoor stops. May reaches 20.3 °C but still has 85.6 mm and 8.9 wet days. The amount drops substantially only in June, to 33.7 mm. If either month is possible and you plan many hours outside, June gives you more warmth and considerably less precipitation to factor into the itinerary.
Rainfall totals cover the whole month; wet days count only days with at least 1 mm. They do not describe shower duration or intensity. Highs and lows are means of daily maximum and minimum temperatures.