Travel guides
Faro climate: monthly weather and when to visit
Faro month by month: official climate normals for daily highs and lows, rainfall and wet days, with practical comparisons to help you choose when to visit.
By Compi3 min read
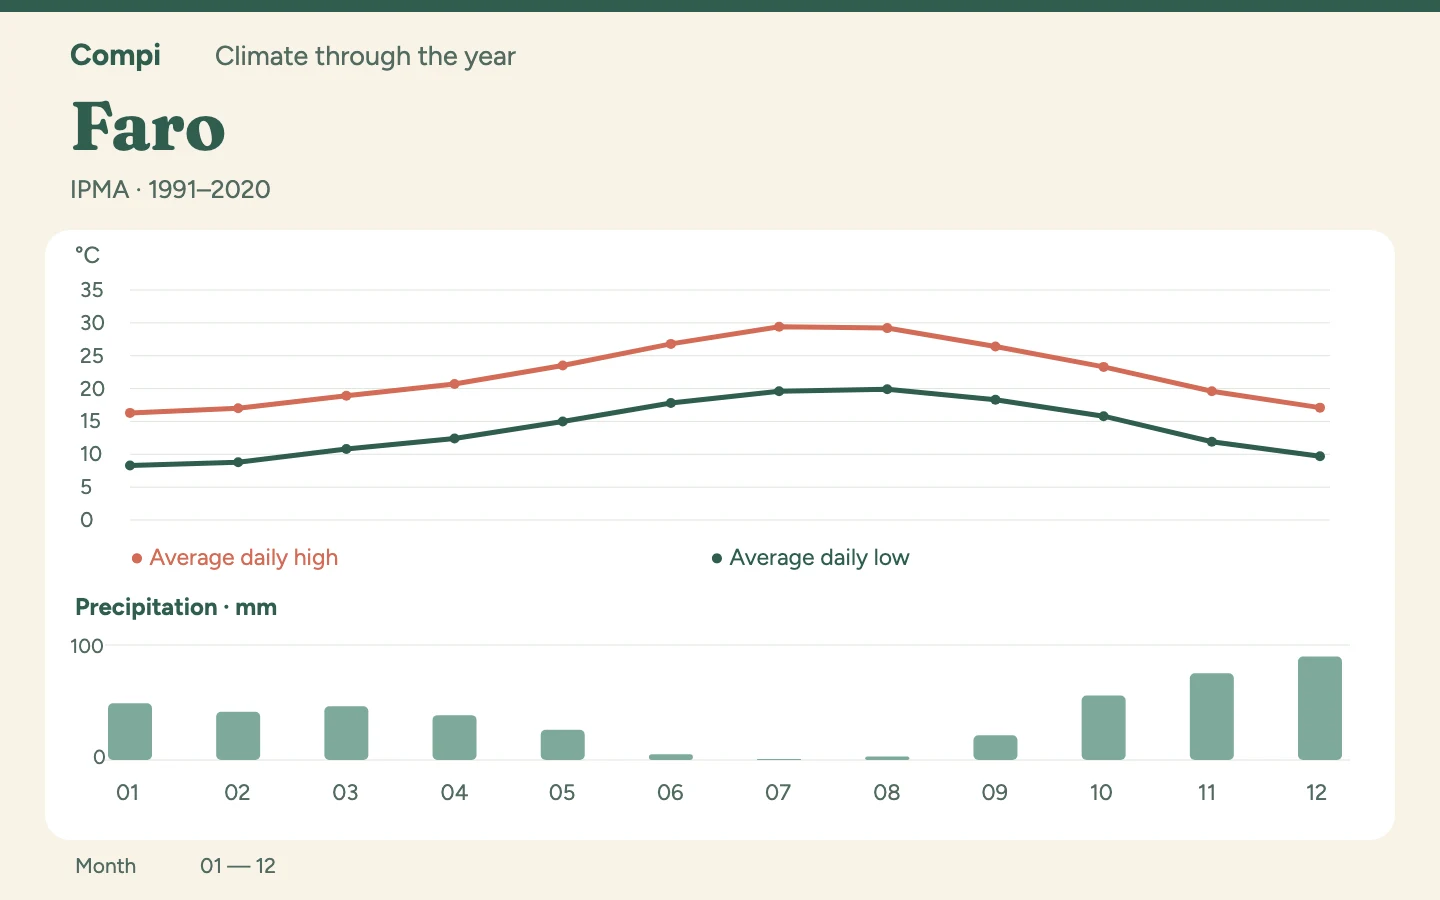
June is a useful choice for Faro if you want warm days with little rain. September has similar daytime temperatures but more precipitation. For cooler city walks, I would consider May. The table describes Faro airport station, rather than every destination across the Algarve.
Which months suit your plans?#
June and September make an especially useful comparison: their average daytime highs are close, while September nights are slightly warmer. Its rainfall total is more than four times June's, however. That does not rule September out; it suggests leaving more room to rearrange outdoor plans. May and October are another similarly warm pair, with the spring month again recording less precipitation.
All twelve months#
Source: IPMA, Faro station (554), elevation 5.0 m; climate normals 1991–2020. The IPMA series combines observations with locally modelled data.
| Month | Avg daily high °C | Avg daily low °C | Precipitation mm | Days with ≥ 1 mm |
|---|---|---|---|---|
| January | 16.3 | 8.3 | 49.3 | 6.0 |
| February | 17.0 | 8.8 | 41.9 | 5.4 |
| March | 18.9 | 10.8 | 46.8 | 5.6 |
| April | 20.7 | 12.4 | 39.0 | 5.3 |
| May | 23.5 | 15.0 | 26.2 | 3.8 |
| June | 26.8 | 17.8 | 5.1 | 0.8 |
| July | 29.4 | 19.6 | 0.9 | 0.2 |
| August | 29.2 | 19.9 | 3.0 | 0.2 |
| September | 26.4 | 18.3 | 21.5 | 1.9 |
| October | 23.3 | 15.8 | 56.0 | 6.0 |
| November | 19.6 | 11.9 | 75.5 | 6.6 |
| December | 17.1 | 9.7 | 90.0 | 7.0 |
Compare two months directly#
June and September: Average daily highs are 26.8 and 26.4 °C respectively, with lows of 17.8 and 18.3 °C. Rainfall totals are 5.1 versus 21.5 mm, alongside an average of 0.8 versus 1.9 days with at least 1 mm.
May and October: Average daily highs are 23.5 and 23.3 °C respectively, with lows of 15.0 and 15.8 °C. Rainfall totals are 26.2 versus 56.0 mm, alongside an average of 3.8 versus 6.0 days with at least 1 mm.
What air temperature cannot tell you about swimming#
The dry summer months cannot establish swimming conditions. Air temperature is not water temperature, and this airport dataset does not include waves, currents or wind. Check current local information for days by the water instead of treating a low rain total as an all-purpose beach forecast.
Hot summer, wet December#
July and August have the highest average daily highs, 29.4 and 29.2 °C, and the lowest rainfall totals, 0.9 and 3.0 mm. For long walks around Faro, I would favour dry June at 26.8 °C if less heat matters more. The three wettest months by amount are October, November and December, with December leading at 90.0 mm. January, at 49.3 mm, is already drier than October's 56.0 mm, but also cooler: the average high falls from 23.3 to 16.3 °C. Moving from autumn into winter therefore changes much more than the amount of rain you are planning around.
Rainfall totals cover the whole month; wet days count only days with at least 1 mm. They do not describe shower duration or intensity. Highs and lows are means of daily maximum and minimum temperatures.