Travel guides
Miami: monthly climate and when to visit
Miami: compare the drier winter months, the April–May transition and November versus March. Official airport highs, lows and precipitation for every month.
By Compi3 min read
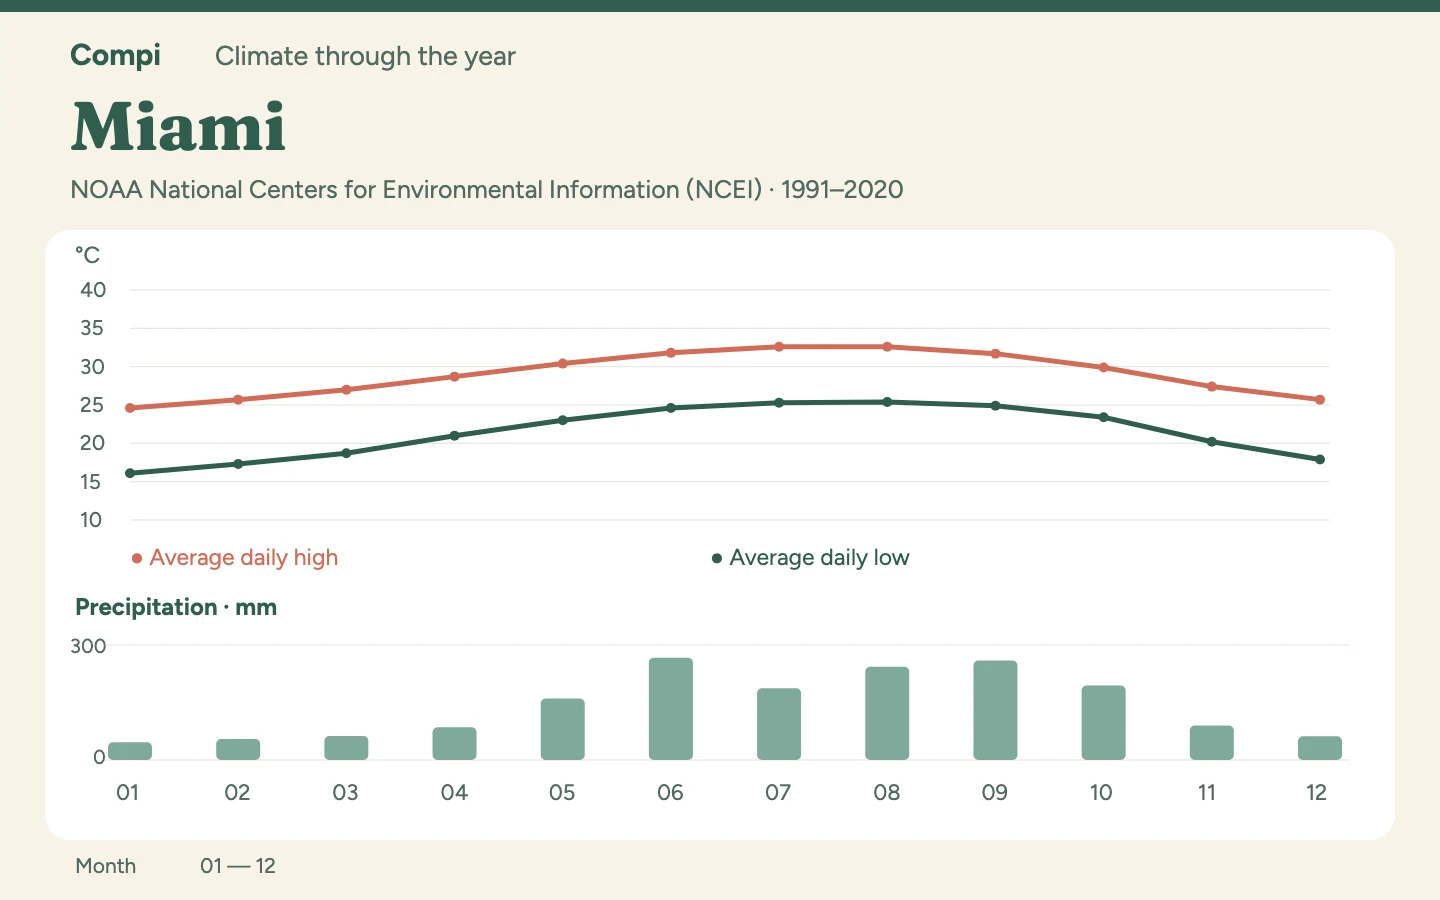
For Miami with long outdoor visits, I would choose December to April. The airport series then shows average highs of 24.6 to 28.7 °C and substantially less precipitation than in summer. March, at 27.0 °C by day and 18.7 °C at night, is a concrete starting point for choosing dates.
Climate table: all twelve months#
Period: 1991–2020. Source: NOAA/NCEI. Station: USW00012839 — MIAMI INTL AP, FL US.
| Month | Average high °C | Average low °C | Precipitation mm |
|---|---|---|---|
| January | 24.6 | 16.1 | 46.5 |
| February | 25.7 | 17.3 | 54.6 |
| March | 27.0 | 18.7 | 62.5 |
| April | 28.7 | 21.0 | 85.3 |
| May | 30.4 | 23.0 | 160.5 |
| June | 31.8 | 24.6 | 267.0 |
| July | 32.6 | 25.3 | 186.9 |
| August | 32.6 | 25.4 | 243.3 |
| September | 31.7 | 24.9 | 259.6 |
| October | 29.9 | 23.4 | 194.3 |
| November | 27.4 | 20.2 | 89.7 |
| December | 25.7 | 17.9 | 62.0 |
What changes between April and June#
The change from April to May matters more than the label spring: precipitation rises from 85.3 to 160.5 mm and the average low increases from 21.0 to 23.0 °C. June already reaches 267.0 mm. If you want warm days without the wetter summer pattern, April therefore offers a different combination from June. More warmth alone would be a poor selection rule here.
July receives less precipitation than June, at 186.9 mm, but remains very warm with an average high of 32.6 °C. In August, even the average low is 25.4 °C. For a visit in those months, I would arrange shorter outdoor blocks and longer indoor breaks. The readings come from Miami International Airport; they are not a separate climate series for Miami Beach or the Florida Keys.
March or November?#
November is an alternative to March. Average highs are almost equal, at 27.4 versus 27.0 °C, while November’s average low is 1.5 °C higher. March has 27.2 mm less precipitation. For warmer evenings the temperature figures favour November; for the lower monthly precipitation total, choose March.
How to read the table#
Highs and lows are averages of the daily temperature limits, not records or forecasts. Precipitation is the average monthly total in millimetres; it does not give the number of wet days. The amount alone also cannot establish whether brief showers or prolonged rain dominate.
Station and data behind the table#
NOAA publishes these figures in Fahrenheit and inches. The conversions are °C = (°F − 32) × 5/9 and mm = inches × 25.4, rounded to one decimal place.
Data: NOAA/NCEI, US Climate Normals, retrieved on 5 November 2026.