Travel guides
Vancouver: monthly climate and when to visit
Vancouver: compare summer with the wetter autumn using official monthly temperatures and precipitation. See what changes between September and October.
By Compi3 min read
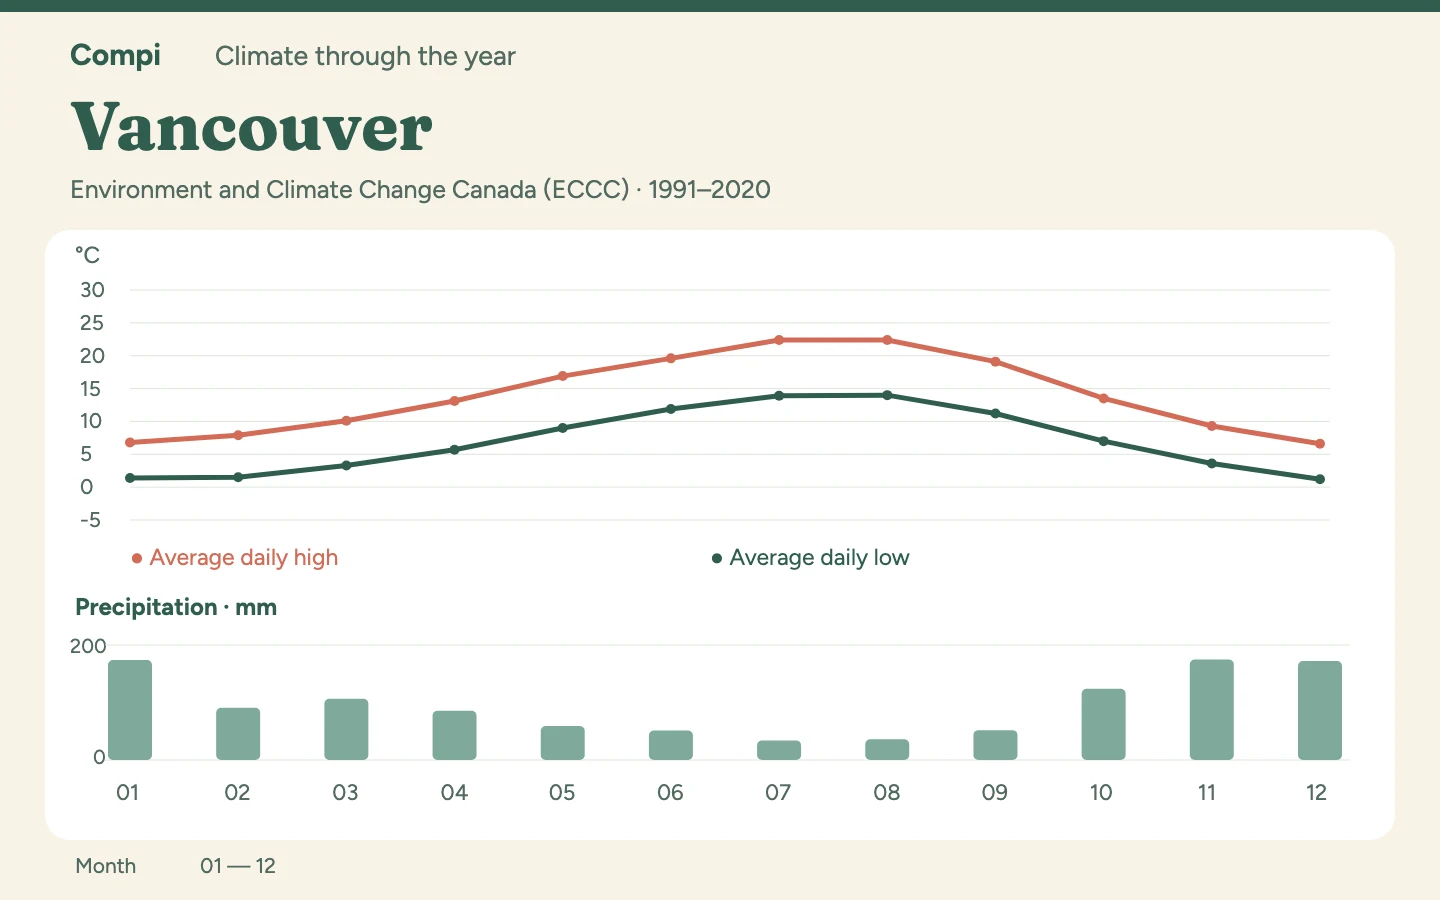
For a walking-focused Vancouver trip, I would choose July or August: both average 22.4 °C by day, with just 34.1 and 36.1 mm of precipitation respectively. September offers a cooler alternative at 19.1 °C. These figures describe Vancouver International Airport, not the mountains north of the city.
Climate table: all twelve months#
Period: 1991–2020. Source: ECCC. Station: Vancouver International Airport — composite station 1108395.
| Month | Average high °C | Average low °C | Precipitation mm |
|---|---|---|---|
| January | 6.8 | 1.4 | 174.0 |
| February | 7.9 | 1.5 | 90.8 |
| March | 10.1 | 3.3 | 106.4 |
| April | 13.1 | 5.7 | 85.5 |
| May | 16.9 | 9.0 | 59.1 |
| June | 19.6 | 11.9 | 51.1 |
| July | 22.4 | 13.9 | 34.1 |
| August | 22.4 | 14.0 | 36.1 |
| September | 19.1 | 11.2 | 51.9 |
| October | 13.5 | 7.0 | 123.9 |
| November | 9.3 | 3.6 | 174.6 |
| December | 6.6 | 1.2 | 172.2 |
September or October?#
The sharp change is between September and October. Precipitation rises from 51.9 to 123.9 mm while average highs fall from 19.1 to 13.5 °C. If long waterfront walks are central to your plans, those neighbouring months offer quite different starting points. An extra jumper addresses the temperature change; October also calls for a day plan that works in wet weather.
A relatively mild winter still does not make this a warm winter escape. January averages a high of 6.8 °C and a low of 1.4 °C. For a city visit, I would combine shorter outdoor stretches with longer indoor breaks. Airport readings cannot tell you the snow conditions at a ski resort or the weather on a mountain trail.
May or September?#
If July and August do not fit, compare May with September. September is 2.2 °C warmer in both average highs and lows, with 7.2 mm less precipitation. For the same city itinerary, that combination favours September; in May, the extra warm layer is more likely to matter from the start of the day.
Winter: plan for more precipitation#
November to January also form the wettest stretch, with monthly totals of 174.6, 172.2 and 174.0 mm. A winter visit therefore fits a plan with short outdoor stretches and nearby indoor stops better than one built entirely around long walks.
How to read the table#
Highs and lows are averages of the daily temperature limits, not records or forecasts. Precipitation is the average monthly total, including the water equivalent of snow; it describes neither snow depth nor the number of wet days. The amount alone also cannot establish whether brief showers or prolonged rain dominate.
Station and data behind the table#
The Canadian series is an official composite: observations from linked stations form the normal-period record. Data gaps differ by variable. This table uses the published monthly figures without filling missing observations ourselves.
Data source: Environment and Climate Change Canada, Historical Climate Data, extracted on 5 November 2026. Used under the ECCC Data Services End-use Licence.